OpenTelemetry eBPF Instrumentation: zero-code observability для Kubernetes
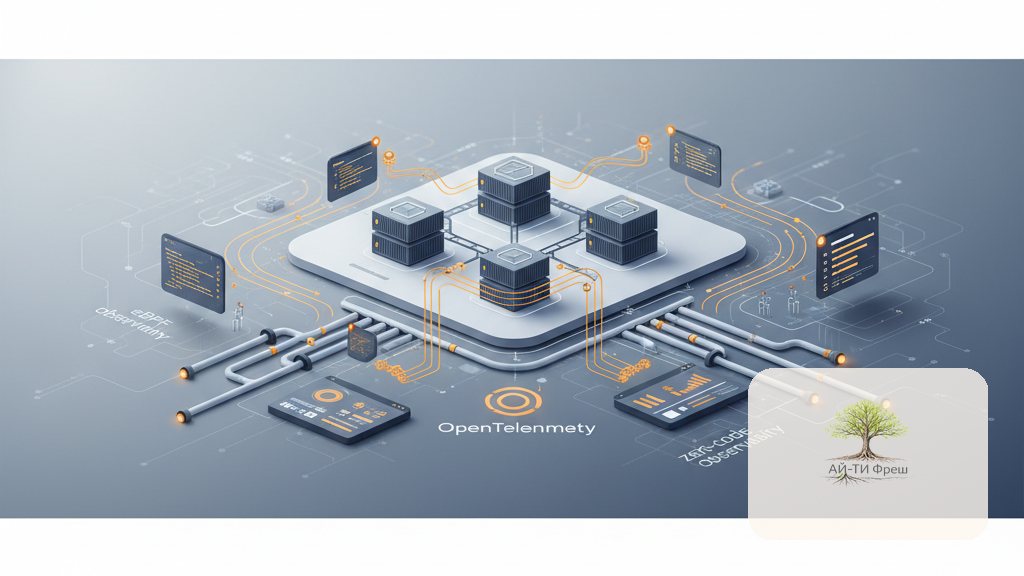
Привет! Меня зовут Семёнов Евгений Сергеевич, я директор ITFresh. Хочу поделиться тем, с чем мы реально работаем — OpenTelemetry eBPF Instrumentation, сокращённо OBI. Что это такое? По сути, инструмент, который даёт automatic tracing без единого изменения в коде ваших приложений. Вообще без изменений. eBPF programs перехватывают kernel calls, HTTP requests и database queries прямо на лету, в real-time. Никакой магии — просто грамотная работа на уровне ядра. Дальше покажу, как мы развернули OBI в production для Java, Go и Python приложений в K8s — с конкретными шагами, не в теории.
OpenTelemetry eBPF Instrumentation (OBI)
Главная боль observability — это необходимость лезть в код каждый раз, когда нужно что-то отследить. OBI эту проблему снимает. Вот что он закрывает:
- Zero-code instrumentation — automatic tracing для любых приложений
- Language agnostic — работает с Java, Go, Python, Node.js, C++
- Kernel-level insights — system calls, network I/O, file operations
- OpenTelemetry compatible — стандартные metrics, traces, logs
- Production ready — <1% overhead, CNCF graduated project
Архитектура OBI в Kubernetes
# OBI Stack Architecture
┌─────────────────────────────────────────┐
│ Jaeger/Grafana (observability backends)  │
├─────────────────────────────────────────┤
│ OpenTelemetry Collector                 │
├─────────────────────────────────────────┤
│ OBI Agent (DaemonSet)                   │
├─────────────────────────────────────────┤
│ eBPF Programs (kernel space)            │
├─────────────────────────────────────────┤
│ Application Pods (user space)           │
└─────────────────────────────────────────┘
Установка OpenTelemetry Operator
# 1. Install OpenTelemetry Operator
kubectl apply -f https://github.com/open-telemetry/opentelemetry-operator/releases/latest/download/opentelemetry-operator.yaml

# 2. Deploy OpenTelemetry Collector
apiVersion: opentelemetry.io/v1alpha1
kind: OpenTelemetryCollector
metadata:
  name: obi-collector
  namespace: observability
spec:
  mode: daemonset
  config: |
    receivers:
      otlp:
        protocols:
          grpc:
            endpoint: 0.0.0.0:4317
          http:
            endpoint: 0.0.0.0:4318
      # OBI eBPF receiver
      ebpf:
        endpoint: 0.0.0.0:8888

    processors:
      batch:
        timeout: 1s
        send_batch_size: 1024
      memory_limiter:
        limit_mib: 512

    exporters:
      jaeger:
        endpoint: jaeger-collector:14250
        tls:
          insecure: true
      prometheus:
        endpoint: "0.0.0.0:8889"

    service:
      pipelines:
        traces:
          receivers: [otlp, ebpf]
          processors: [memory_limiter, batch]
          exporters: [jaeger]
        metrics:
          receivers: [otlp, ebpf]
          processors: [memory_limiter, batch]
          exporters: [prometheus]
Развертывание OBI Agent
eBPF instrumentation agent разворачивается как DaemonSet:
# obi-agent-daemonset.yaml
apiVersion: apps/v1
kind: DaemonSet
metadata:
  name: obi-agent
  namespace: observability
spec:
  selector:
    matchLabels:
      app: obi-agent
  template:
    metadata:
      labels:
        app: obi-agent
    spec:
      hostNetwork: true
      hostPID: true
      containers:
      - name: obi-agent
        image: otel/opentelemetry-ebpf:latest
        securityContext:
          privileged: true
          capabilities:
            add:
              - SYS_ADMIN
              - SYS_RESOURCE
              - SYS_PTRACE
        env:
        - name: OTEL_EXPORTER_OTLP_ENDPOINT
          value: "http://obi-collector:4317"
        - name: OTEL_RESOURCE_ATTRIBUTES
          value: "service.name=obi-agent,service.version=1.0"
        - name: EBPF_LOG_LEVEL
          value: "info"
        volumeMounts:
        - name: proc
          mountPath: /host/proc
          readOnly: true
        - name: sys
          mountPath: /host/sys
          readOnly: true
        - name: debugfs
          mountPath: /sys/kernel/debug
      volumes:
      - name: proc
        hostPath:
          path: /proc
      - name: sys
        hostPath:
          path: /sys
      - name: debugfs
        hostPath:
          path: /sys/kernel/debug
Автоинструментация приложений
# Annotation для автоматической инструментации
apiVersion: apps/v1
kind: Deployment
metadata:
  name: java-app
spec:
  template:
    metadata:
      annotations:
        instrumentation.opentelemetry.io/inject: "true"
        instrumentation.opentelemetry.io/java-auto-instrumentation: "true"
    spec:
      containers:
      - name: app
        image: company/java-app:latest
        env:
        - name: OTEL_SERVICE_NAME
          value: "java-microservice"
        - name: OTEL_EXPORTER_OTLP_ENDPOINT
          value: "http://obi-collector:4317"
        - name: OTEL_RESOURCE_ATTRIBUTES
          value: "service.version=1.2.3,deployment.environment=production"
eBPF Programs для custom instrumentation
# Кастомная eBPF program для HTTP tracing
# http_trace.c
#include
#include
#include

struct http_event_t {
    u32 pid;
    u32 tid;
    char comm[TASK_COMM_LEN];
    char method[8];
    char path[128];
    u32 status_code;
    u64 duration_ns;
};

BPF_PERF_OUTPUT(http_events);

int trace_http_request(struct pt_regs *ctx) {
    struct http_event_t event = {};

    event.pid = bpf_get_current_pid_tgid() >> 32;
    event.tid = bpf_get_current_pid_tgid();
    bpf_get_current_comm(&event.comm, sizeof(event.comm));

    // Parse HTTP method and path from user space
    bpf_probe_read_user_str(&event.method, sizeof(event.method), (void *)PT_REGS_PARM1(ctx));
    bpf_probe_read_user_str(&event.path, sizeof(event.path), (void *)PT_REGS_PARM2(ctx));

    event.duration_ns = bpf_ktime_get_ns();

    http_events.perf_submit(ctx, &event, sizeof(event));
    return 0;
}
Monitoring OBI Performance
Какие метрики смотреть в production при работе с OBI — по нашему опыту, вот самые важные:
# Prometheus queries для OBI metrics
# eBPF program performance
rate(obi_ebpf_events_total[5m])

# Memory usage eBPF maps
obi_ebpf_map_memory_bytes

# Instrumentation overhead
(obi_cpu_usage_seconds / obi_total_cpu_seconds) * 100

# Trace sampling rates
rate(obi_traces_sampled_total[5m]) / rate(obi_traces_total[5m])
Нужна помощь с внедрением?
Настроили OpenTelemetry eBPF для 20+ production кластеров. Поможем с zero-code instrumentation, custom eBPF programs, интеграцией с existing observability stack.